MLOps Best Practices 2023 — Part I
This article is a summary of my learning of MLOps Engineering in production from Coursera

Hi everyone, i hope all is good, today I will summarize the best practices of MLOps for production that I have learned so far.
Let’s start with the Common Deployment strategies:
- Shadow Model: where ML systems shadow the human and run in parallel. Here ML systems’ output is not used for any devices during this phase.
- Canary Deployment*: Roll out to a small fraction of the traffic (eg. 5%) then monitor the results and ram up traffic gradually.
- Blue Green Deployment*: 2 Models are deployed in parallel which helps us to enable rollback during downtime or for load sharing.
One of the Degrees of Automation that we can think of is ‘Human in the loop’ for improving the accuracy of the model via feedback loop like
Human Only> Shadow Mode > Ai Assistance> Partial Automation> Automation
Monitoring DashBoards is also another topic in MLOps which can be further categorized as Software Metrics: Memory, computation, latency throughput, load etc. Input Metrics include average input length, Average input column, number of missing values, average image brightness etc. and the Output Metrics include residual analysis, target(y) has changed in some ways etc..
Selecting and training a model
Offcourse we can use the state-of-the-art/open-source model along with its technical capabilities but from the practical implementation perspective no matter how new state of the art model is there will be use cases where we will have low accuracy even with extensive hyperparameter tunning, so for the such scenario we need to set a baseline, we will call it as HLP (Human Level Performance)
We all know that in machine learning we try to replicate the SME(subject matter specialist) skill sets for automation Right? What if for use cases where human-level performance is up to 60% accuracy then we can expect machine learning also to give approximate similar accuracy.
That's why it is important to understand and set the baseline accuracy of any ML use-case. The next step is to look for possible ways for improvement.
Error Analysis and Performance
let’s take tags to understand the error analysis and its performance. Tags here refer to any properties of the data like classes, feature attributes, categories distribution, feature variance distribution, and so on and so forth. Now useful metrics for each tag:
- What fraction of errors have that tag?
- What fraction of the tag is misclassified? (example: target/classes)
- What fraction of the tag is distributed?
- And how much room for improvement on the data for the tag.
Establish metrics to assess performance against the appropriate slices of data like mean accuracy for different gender, mean accuracy on different devices etc.
ML Model Approach changed from Model-Centric to Data-Centric because:
Model-Centric View: take the data you have and develop a model that does as well as possible on it.
Data-Centric View: the quality of the data is paramount, with quality data model training you can get a very good balanced bias-variance model and with proper model inferences.
Can adding data hurt model performance?
No, but there are some caveats like the model will be large(low bias), it will be computationally expensive in production.
We can easily find it out whether we need more data or whether our sample data represents the actual population via a Distribution plot or by hypothesis testing.
Feature Engineering
Feature engineering can be decisive at the same time we can easily lose our track of whether the engineered feature is actually contributing to the model prediction or not.
So we should first create a baseline model with its error analysis then we will look for improvement via the feature engineering process and compare before and after error analysis. There we go we will have our answers!
Detecting Data Issues
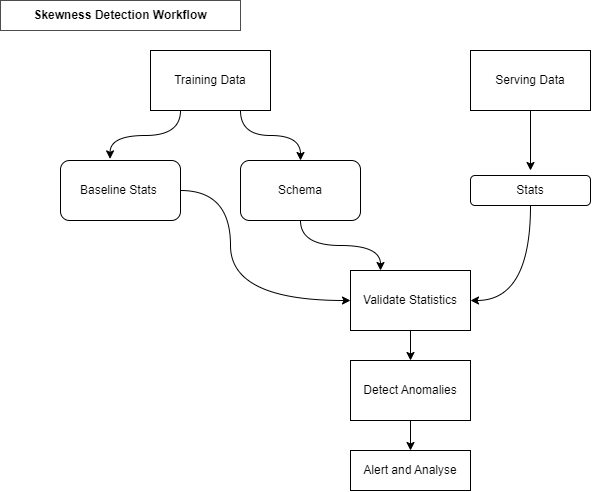
- Detecting Schema Skew — Training and serving data do not conform to the same schema. Example: expecting integer because the model was training with integer value but got string, category, float etc.
- Detecting distribution Skew — is a divergence of training and serving dataset. The dataset shifts can be really manifested by covariants and concepts and other types of shits.
- Requires continuous evaluation — Skew detection involves continuous evaluation of data coming to your server once you train your model.
Detecting Distribution Skew:
- Data Shift occurs when the joint probability of X are features and y are labels is not the same during training & serving.
- Covariance Shift: refers to the change in the distribution of the input variables present in training & serving data.
- Concept Shit: refers to a change in the relationship between in the input and the output variables as opposed to the differences in the data distribution or input itself.
Univariate Feature Selection
There are N number of ways to perform univariate feature selection. By now you might know more than me scattered across for sure.
Let me reorganize them all as possible.
- At SQL Level: there will be 1000 of features and we need to export them batch-wise feature sample dataset (like 350 features at a time) and then merge them, a very tedious and time-consuming process. So the solution is to put a condition ‘ where table1.col1 <> not equal to NULL’ or <> not equal to 80% of them are null. Now you are left out with 600 features(as an example)
- At Python Level: Eliminate features(categorial and numerical) with ‘near zero variance’ which means features have 90% most of the time the same value and will have(probability) 90% of the time the same value. Now we are left with 350 features(as an example)
- Multi-colinearity: Perform Pearson's correlation coefficient to remove attributes(Numeric) that have the same variance/ correlation. Its like having a duplicate/ twin features, delete one and retain the other. Now we are left with 250 features(as an example)
- Multi-colinearity: Perform Chi-square test for categorial or create a function to compare the categorial attributes and correlation. Now we have 150 features(as an example)
- Feature Importance: Run a base model like a random forest to get the important features. Non-parametric model-based feature importance is highly preferable because they are not affected by any assumptions like in Hypothesis test anova, paired, t-test, Kendall rank coefficient, Somer-d, Wilcoxon signed ranked test etc. Now we will are left with 50 important features.
Do consult with the SMEs about the features that got discarded at each iteration.
Apart from this there are other build-in wrapper functions available like Select KBest, Select Percentile, and Auto Feature Selection using Bregman Divergence & Itakura Saito developed by me available at https://pypi.org/project/auto-feat-selection/
Importance of Schema:
Schema plays an important role in:
Reliability during data evaluation from * Inconsistent data *Software might generate unexpected errors * User configuration *Execution Environments or any other anomalies.
The usefulness of Semi-Supervised Learning in Production.
Active Learning: very helpful in the following situations:
— Constrained data budgets where we can only afford labeling for few data points.
— Imbalanced dataset: helps selecting rate classes for training
— -Target Metrics: when baseline sampling strategy doesn't improve selected metrics.
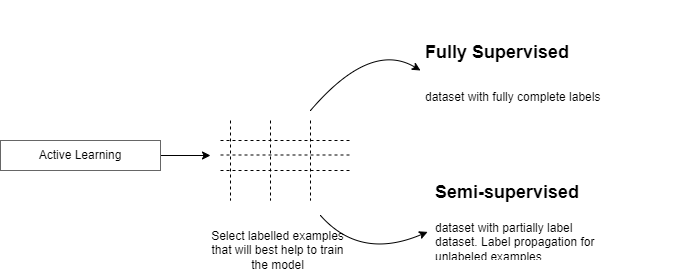
Label Propagation: is a semi-supervised ML algorithm used for datasets where a subset of the data has labels. Labels are propagated to the unlabeled points. The algorithm will internally fit the labeled data points to predict the unlabeled data points to retrain the model.
Neural Networks MLOps best practices in production.
Yes, neural networks will perform a kind of automatic feature selection. However, that's not as efficient as a well-designed dataset and model. Much of the model can be largely “shut off” to ignore unwanted features. Even unused parts consume space and compute resources.
Neural Networks for IoT and Edge Computing.
Challenges:
- Neural Networks have many parameters as they take up space.
- Model file size.
- Reduce computational resources
- Make models run faster and use less power with low precision.
Why quantize Neural Networks?
Benefits: Faster Compute, Low memory bandwidth, Low power.
What parts of the model are affected?
Static values(parameters)
Dynamic Values(activations)
Computation(Transformations)
Few solutions: * Reduce precision representation, Incur small loss in model accuracy, joint optimization for model and latency or multi-model approach for each class, define the target you wanna achieve.
Distributed Training is also an important factor of MLOps
Types of distributed training:
- Data Parallelism: in data parallelism models are replicated onto different accelerators(GPU/TPU) and data is split between them
- Model Parallelism: when models are large to fit on a single device than they can we divided into partitions, assigning different partitions to different accelerators.
Why input pipelines?
Data at sometimes can’t fit into memory and sometimes CPUs are under-utilized in compute-intensive tasks like training a complex model. We can avoid these inefficiencies by making most of the hardware by using input pipelines.
without pipeline

with pipeline

High-Performance Modeling
For example, GoogleLeNet → a very deep neural network and it becomes impossible to fit in edge devices.
Can we have a small and efficient model?
Duplicate the performance of a complex model in a simpler model. that's the goal of knowledge distillation
Rather than optimizing the network implementation, Knowledge distillation seeks to create a more efficient model which captures the same knowledge in a more complex model.
We can name it as Teacher-Student Model
— Teacher (normal training) *maximizes the actual metric
— Student(knowledge transfer) * matches the p-distribution of the teacher's prediction to form ‘soft targets. Soft targets tell us about the knowledge learned by the teacher.
Advanced Model Analysis & Debugging
Informational : * Membership Inference: was this data used for training. * Model Inversion: recreate the training data. *Model Extraction: recreate the model
Behavioral: *Poisoning: Insert malicious data into training data. *Evasion: input data that causes the model to intentionally misclassify the data.
Measure the vulnerability of your model via
Cleverhans: an open source python library to benchmark machine learning system’s vulnerability to adversarial examples
Foolbox: an open-source python library that lets you easily run adversarial attacks against machine-learning models.
Defensive Distillation: advanced method. In other words, instead of transferring knowledge between different architectures, the authors proposed using knowledge distillation to improve a model’s own resilience to attacks.
Residual Analysis
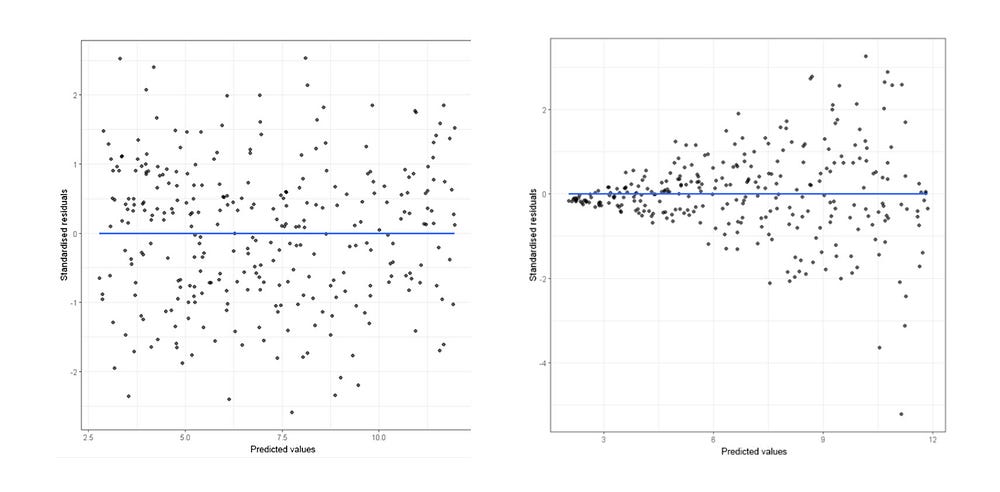
- Residual should not be correlated with another feature that was available but was left out of the feature vector. if you can predict the residuals with another feature that feature should be included int eh feature vector, This requires checking the unused features for correlation with residuals.
- Adjacent residuals shouldn't be correlated with each other(autocorrelation). In other words they should not be autocorrelated → if we can use residual to predict the next residual then there's some predictive information that is not being captured by the model (Residual Plot).
- Dubin Watson test is also used for detecting autocorrelation.
Model Remediation — How can you make your model robust to sensitivity?
Data Augmentation: Adding synthetic data into the training set. Helps to correct unbalanced training data.
Interpretable and explainable ML: Overcome the myth of neural networks as the black box. Understand how data is getting transferred.
Remediation Techniques:
Model Editing: *Applies to decision trees. * Override model predictions
Model Assertion: * Implement business rules that override model predictions.
Model Monitoring: * Anomaly detection.
Error Monitoring:
- Statistical Process Control
- The method used in the drift detection method.
- Mode no. of errors as a binomial random variable
- Alert rule
2. Sequential Analysis
- If data is used stationary, the contingency table should remain constant
3. Error distribution monitoring
- The method used in Adaptive Window(ADWIN)
- Calculate the mean error rate at every window of data
- Sige of window adapts, becoming shorter when data is not satisfactory.
4. Clustering/Novelty detection(unsupervised)
- Assign data to now cluster or detect emerging concepts.
- Multiple algorithms available: OLINDDA, MINAS, ECS Miner and GC3
5. Feature Distribution Monitoring(unsupervised)
- Monitors individual features separately at every window of data
- Algorithms to compare → Pearson Correction in Change of concept, Hellinger Distance in HDDM.
6. Model-dependent monitoring(unsupervised)
- concentrate efforts near the decision margin in latent space.
- one algorithm in Margin Density Drift Detection(MDS)
Responsible AI
Responsible Ai arises new questions like
Fairness — Ensure working towards systems that are fair and inclusive to all users. Explainlity helps ensure fairness.
Explainability — understanding how and why ML models make certain predictions. Explainability helps ensure fairness.
Privacy—training models require data that needs privacy-preserving safeguards for legal and regulatory concerns.
Security— Identifying potential threats can help keep Ai systems safe and secure.
Interpretability can be of 2 types
Model Specific or Model Agnostic
Model Specific: These tools are limited to specific models. eg. Interpretation of regression weights in linear models. Intrinsically interpretable model techniques are model specific.
Model Agnostic: Applied to any model often it is trained. Donot have access to the internals of the model. Work by analyzing feature input and output airs.
Model Agnostic Methods: Partial Dependence Plot, Individual Conditional Expectation, Accumulated Local Effects, Local Surrogate(LIME), Shapley Values, Shap(Shapley Addictive Explanations), Permutation Feature Importance, Global Surrogate
Deployment Scenarios(Real Time) in production,
preferred batch processing of data, each batch with different process/parallel processing for. If one output depended or input to another model batch processing is not advisable due to low latency.
Experimental Training.
What does it mean to track experiments?
Enables you to duplicate a result
Enables you to meaningfully compare experiments.
Manage code/ data versions, hyperparameters, environments, and metrics.
Organize them in a meaningful way.
and make them available to access and collaborate on within your organization.
Standardizing ML process with MLOps
ML Lifecycle Management
Model Versioning & iteration
Model Monitoring & Management
Model Governance
Model Security
Model Discovery
MLOps Workflow
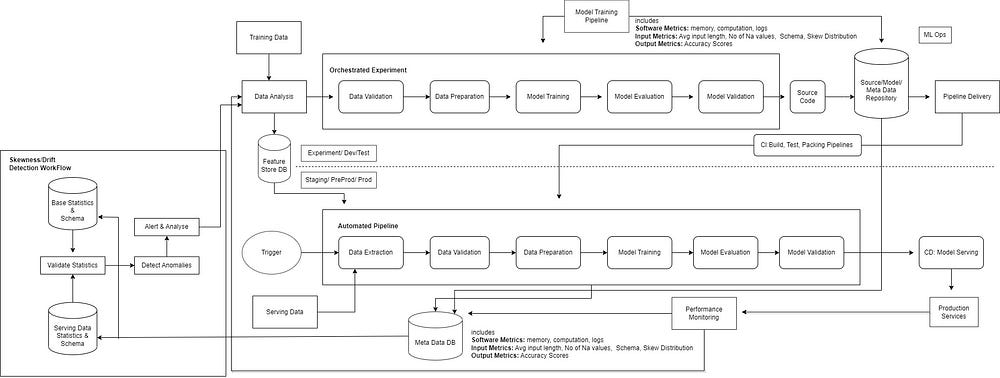
This is a modified version of the original MLOps workflow diagram for the best fit. if the above diagram is not clear probably because of its size. So below i have split the diagram into 3 parts
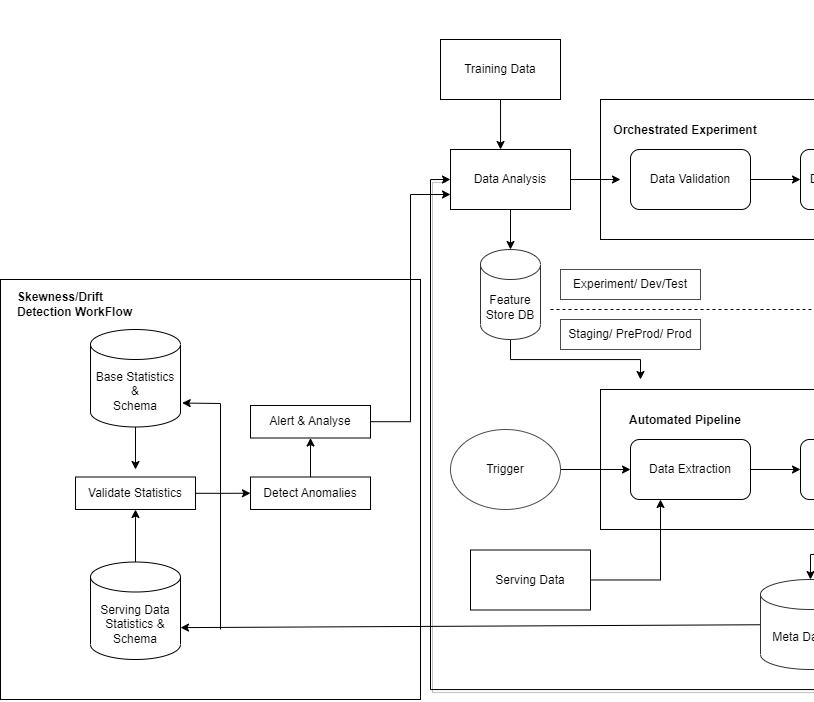
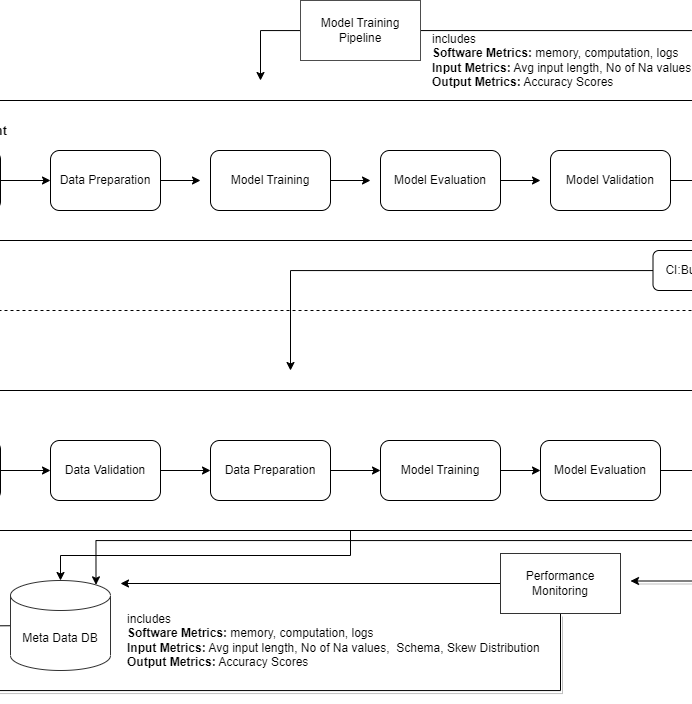
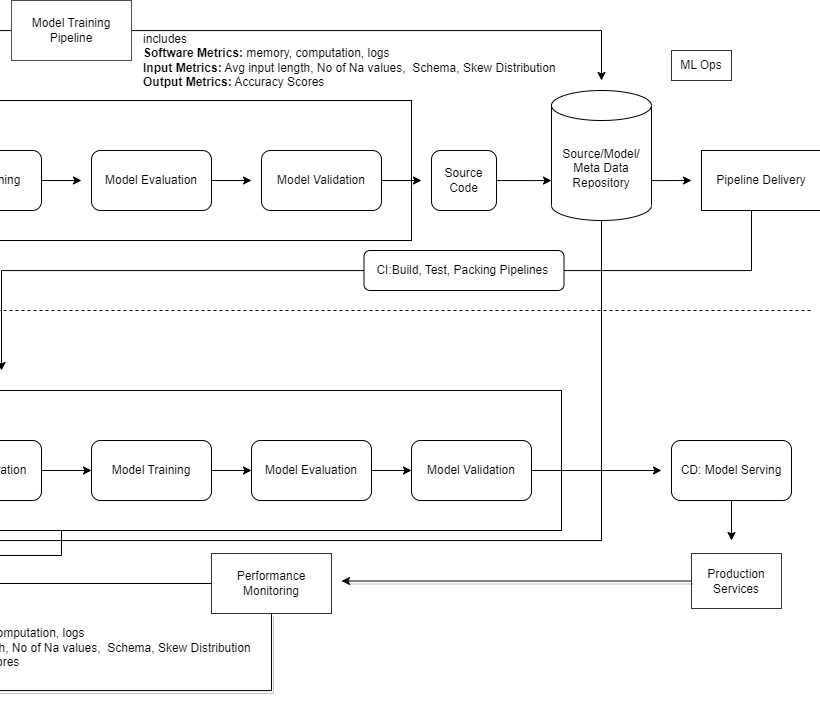
From another view.
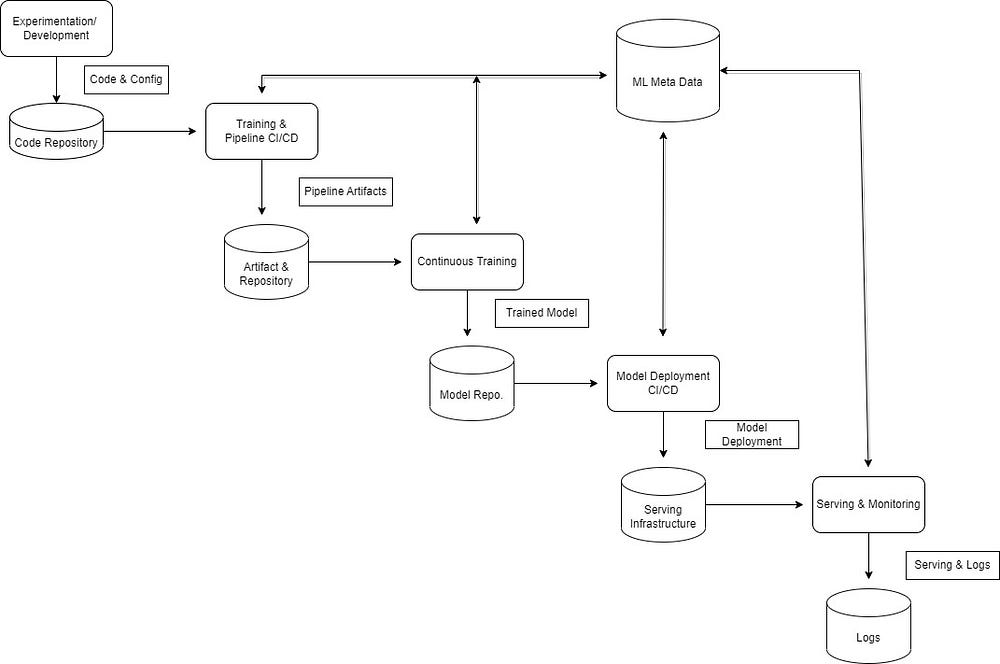
What is continuous Integration(CI)?
- Triggered when new code is pushed or committed.
- Build packages, container images, executables, etc.
- Performs unit & integration tests for the components.
- Delivers the final package to the Continuous Delivery pipeline.
What is Continuous Delivery(CD)?
- Deploys new code and trained models to the target environment.
- Ensures compatibility of code and model with that target environment.
- Checks the prediction service performance of model before deploying.
CI/CD Infrastructure
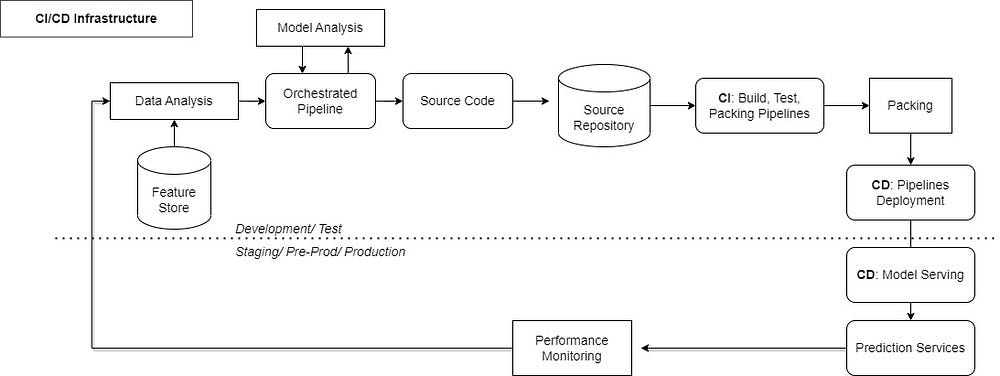
Progressive Delivery is another concept that is essentially an improvement over Continuous Delivery.
Decrease Deployment risk.
Faster Deployment
Gradual roll out on ownership
Simple progressive delivery:
Blue/Green Deployment
Canary Deployment(where few traffic is transferred)
Live Experiments like A/B Testing, and Multi-Arm Bandit.
What is model decay?
causes of model decay — 1. Data Drift 2. Concept Drift
1. Data Drift(aka Feature Drift):
→ Statistical properties of input changes.
→ Trained model is not relevant for changed data.
→ For eg distribution of demographic data like age might change over time.
2. Concept Drift:
→ Relationship between features and labels changes. Eg. if your model is still predicting for T1 when the world is moved to T3 many of its predictions will be incorrect.
→ The way the meaning of what you're trying to predict changes.
Ways to mitigate Model Decay
Steps in mitigating model decay.
What if drift is detected?
- if possible, determine the portions of your training set that is still correct.
- keep the good data, discard the bad and add new data — or —
- discard the data collected before a certain date and add new data — or —
- create an entirely new training dataset from new data.
Done…. that is I have learned so far from the course and tried to modify and summarize in short to simplify as possible.
I hope you will find it useful for your daily requirements.
Next, i will try to share a template, MLOps best coding plug-n-play template, stay tuned.
Thanks again, for your time, if you enjoyed this short article there are tons of topics in advanced analytics, data science, and machine learning available in my medium repo. https://medium.com/@bobrupakroy
Some of my alternative internet presences are Facebook, Instagram, Udemy, Blogger, Issuu, Slideshare, Scribd, and more.
Also available on Quora @ https://www.quora.com/profile/Rupak-Bob-Roy
Let me know if you need anything. Talk Soon.

Comments
Post a Comment