Tweedie Regressor: Generalized Linear Model with a Tweedie distribution.
Tweedie Regressor
Generalized Linear Model with a Tweedie distribution.

Hello there. today we will look into an unusual regressor named as Tweedie Regressor.
Sklearn states Tweedie Regressor as a Generalized Linear Model with a Tweedie distribution.
Wiki, In probability and statistics, the Tweedie distributions are a family of probability distributions which include the purely continuous normal, gamma and Inverse Gaussian distributions, the purely discrete scaled Poisson distribution, and the class of compound Poisson–gamma distributions which have positive mass at zero, but are otherwise continuous.[1] Tweedie distributions are a special case of exponential dispersion models and are often used as distributions for generalized linear models.[2]
This tweedie estimator can be used to model different GLMs depending on the power parameter, which determines the underlying distribution.
Parameter: power float, default=0
The power determines the underlying target distribution according to the following table:
Power Distribution
0      Normal
1      Poisson
(1,2)  Compound Poisson Gamma
2      Gamma
3      Inverse Gaussian
Let’s apply the Tweedie Regressor with the help of an example
import numpy as np
import matplotlib.pyplot as plt
import pandas as pd
import sklearn
import seaborn as sns
from pandas import read_csv
from pandas.plotting import scatter_matrix
df = pd.read_csv("1000_Companies.csv")sns.displot(df.Profit)
sns.heatmap(df.corr(),annot=True)
for x in ["Profit"]:
    q75,q25 = np.percentile(df.loc[:,x],[75,25])
    intr_qr = q75-q25

    max = q75+(1.5*intr_qr)
    min = q25-(1.5*intr_qr)

    df.loc[df[x] < min, x] = np.nan
    df.loc[df[x] > max, x] = np.nan
#drop alll the rows that have null values
df.dropna(inplace=True)
#check the datatypes
df.dtypes
#convert the State column
df = pd.get_dummies(df,drop_first=True)
X= df.drop("Profit",axis=1)
y = df["Profit"]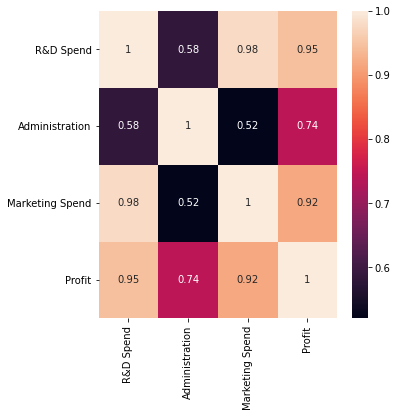
Basic Data Preprocessing is done. Now the model part.
from sklearn.model_selection import train_test_split
X_train,X_test, y_train, y_test = train_test_split(X,y,test_size=0.25, random_state=1)
from sklearn import linear_model
model = linear_model.TweedieRegressor(max_iter=500).fit(X_train,y_train)
model.score(X_train,y_train)
#predict
y_pred = model.predict(X_test)
#Evaluation
from sklearn.metrics import mean_absolute_error
from sklearn.metrics import mean_squared_error
print("Mean Square Error", mean_absolute_error(y_pred,y_test))
print('RMSE',np.sqrt(mean_absolute_error(y_pred,y_test)))
print("Mean Abosulute Error", mean_absolute_error(y_pred,y_test))
#plot to check if tweedieregressor follows linear regression
fig, ax = plt.subplots()
ax.scatter(y_test,y_pred,edgecolors=(0,0,0))
ax.plot([y.min(),y.max()],[y.min(),y.max()], 'k--',lw=4)
ax.set_xlabel("Measured")
ax.set_ylabel("Predicted")
plt.show()
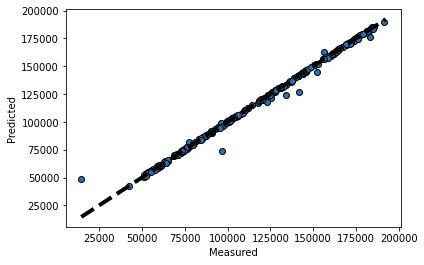
Well that's it. We can observe from the tweedieregressor power parameters that the tweedie regression can be used for different types of distribution like Poisson, Compound Poisson Gamma, Gamma, Inverse Gaussian including normal distribution which in turn will be very helpful.
Check out the tweedie code implementation at Kaggle:
Explore and run machine learning code with Kaggle Notebooks | Using data from 1000_companies_profitwww.kaggle.com
Thanks, for your time, if you enjoyed this short article there are tons of topics in advanced analytics, data science, and machine learning available in my medium repo. https://medium.com/@bobrupakroy
Some of my alternative internet presences Facebook, Instagram, Udemy, Blogger, Issuu, Slideshare, Scribd and more.
Also available on Quora @ https://www.quora.com/profile/Rupak-Bob-Roy
Let me know if you need anything. Talk Soon.


Comments
Post a Comment