Pip install autoroc, Automation to Optimal Threshold of Auc ROC curve

Hi everyone, how are you doing? good great.
Today i will introduce you to my own customized pip package to automate the value for the best threshold from AUC ROC curve.
We are already aware of the auc roc plot and why it is used. if not let me give you one-liner answer the auc roc plot is used to find the optimal threshold to take into consideration or believe in our classification.
Let us understand how to apply autoroc with the help of an example.
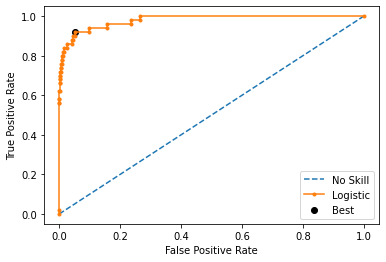
# roc curve for logistic regression model with optimal threshol
from numpy import sqrt
from numpy import argmax
from sklearn.datasets import make_classification
from sklearn.linear_model import LogisticRegression
from sklearn.model_selection import train_test_split
from sklearn.metrics import roc_curve
from matplotlib import pyplot
# generate dataset
X, y = make_classification(n_samples=10000, n_features=2, n_redundant=0,
	n_clusters_per_class=1, weights=[0.99], flip_y=0, random_state=4)
# split into train/test sets
trainX, testX, trainy, testy = train_test_split(X, y, test_size=0.5, random_state=2, stratify=y)
# fit a model
model = LogisticRegression(solver='lbfgs')
model.fit(trainX, trainy)
# predict probabilities
yhat = model.predict_proba(testX)
# keep probabilities for the positive outcome only
yhat = yhat[:, 1]d
Now let’s use the traditional way
# calculate roc curve
fpr, tpr, thresholds = roc_curve(testy, yhat)
# calculate the g-mean for each threshold
gmeans = sqrt(tpr * (1-fpr))
# locate the index of the largest g-mean
ix = argmax(gmeans)
print('Best Threshold=%f, G-Mean=%.3f' % (thresholds[ix], gmeans[ix]))
# plot the roc curve for the model
pyplot.plot([0,1], [0,1], linestyle='--', label='No Skill')
pyplot.plot(fpr, tpr, marker='.', label='Logistic')
pyplot.scatter(fpr[ix], tpr[ix], marker='o', color='black', label='Best')
# axis labels
pyplot.xlabel('False Positive Rate')
pyplot.ylabel('True Positive Rate')
pyplot.legend()
# show the plot
pyplot.show()
Well, we all know this.
AUC Area under the curve is a performance measurement for the classification problems at various threshold settings. and ROC is a probability curve. AUC represents the degree or measure of speratibility. It tells us how much the model is capable of distinguishing between classes. The higher the AUC the better the model is at predicting 0 & 1
Now we cant visualize each and every time when we have to go for automation. So this is where my customized package comes to the rescue named autoroc
from autoroc_rupakbob import autoroc
t, t1 = autoroc.best_threshold(testy,yhat)
Just two lines of code. That’s it!
Now we can easily use the extracted value for further computational purposes.
There is another version that turns out to be much faster and can be used as cross-validation using Youden’s J statistic
from autoroc_rupakbob import autoroc
t3= autoroc.best_threshold_YoudenJstatistic(testy,yhat)
I hope it will be useful somewhere in your use cases. To know more about the package follow the link https://pypi.org/project/autoroc/
or simply use pip install autoroc
Thanks, for your time, if you enjoyed this short article there are tons of topics in advanced analytics, data science, and machine learning available in my medium repo. https://medium.com/@bobrupakroy
Let me know if you need anything. Talk Soon.


Comments
Post a Comment