Anomaly Detection — KDE: using kernel density estimation
Anomaly Detection — KDE
using kernel density estimation

Hi everyone, once again I'm back after a long break with new methodologies. Keeping the article short, simple and straightforward today I will introduce you to another flavor of Anomaly Detection named as Kernel Density Estimation.
We all heard of what is KDE? especially KDE plots, now we will see how can we use it to detect anomalies. Shall we?
Kernel Density Estimation is a technique that leverages the probability density function estimation of the data points randomly in a sample space. Thus with the density function, we can detect anomalies in the data.
Let’s understand this with the help of an example.
from numpy import where, random, array, quantile
from sklearn.preprocessing import scale
import matplotlib.pyplot as plt
from sklearn.datasets import load_boston
#load the KernelDensity Function from sklearn.neigbors
from sklearn.neighbors import KernelDensity
Now a small optional step to prepare a dummy dataset
#prepare the data
def prepData(N):
    X = []
    for i in range(n):
        A = i/1000 + random.uniform(-4, 3)
        R = random.uniform(-5, 10)
        if(R >= 8.6):
            R = R + 10
        elif(R < (-4.6)):
            R = R +(-9)
        X.append([A + R])
    return array(X)

n = 500
X = prepData(n)
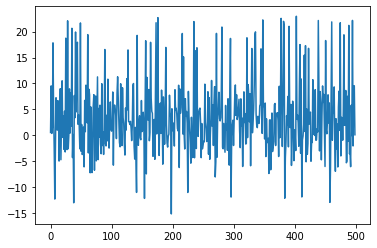
#lets visualize
x_ax = range(n)
plt.plot(x_ax, X)
plt.show()
Now we will apply KDE
kern_dens = KernelDensity()
kern_dens.fit(X)
KDE other parameters include:
KernelDensity(*, self, bandwidth=1.0, algorithm=’auto’, kernel=’gaussian’, metric=”euclidean”, atol=0, rtol=0, breadth_first=True, leaf_size=40, metric_params=None)
Now we will quantile the results to obtain a threshold value.
scores = kern_dens.score_samples(X)
threshold = quantile(scores, .02)
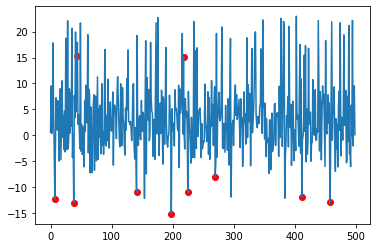
The values with equals to or lesser than the threshold value will be detected and visualized as anomalies.
idx = where(scores <= threshold)
values = X[idx]

plt.plot(x_ax, X)
plt.scatter(idx,values, color='r')
plt.show()
Done Deal….!
The reason why we have always new versions, sets of methods, techniques, algorithms, etc. blah blah blah……is to fit in different or infinite numbers of patterns and scenarios of unstructured data. else life would be easier with just one universal algorithm, isn’t it!
special thanks to machinelearningmastery community for the latest updates.
You may also try the other flavors of this KDE anomaly detection labeled as:
sklearn.neighbors.KDTreeK-dimensional tree for fast generalized N-point
problems.
sklearn.neighbors.BallTreeBall tree for fast generalized N-point
problems.
Thanks again, for your time, if you enjoyed this short article there are tons of topics in advanced analytics, data science, and machine learning available in my medium repo. https://medium.com/@bobrupakroy
Some of my alternative internet presences Facebook, Instagram, Udemy, Blogger, Issuu, Slideshare, Scribd and more.
Also available on Quora @ https://www.quora.com/profile/Rupak-Bob-Roy
Let me know if you need anything. Talk Soon.
Kaggle implementation: https://www.kaggle.com/code/rupakroy/kernel-density-estimation-anomaly-detection


Comments
Post a Comment