Sweetviz — One Liner EDA Visualization Automation Tool Kit Python

Hi everyone I’m again back with another interesting topic called Sweetviz which will help you out to perform full Exploratory Data Analysis aka. EDA in just 2 lines of code and even share them with your colleagues.
Let’s get started.
First, install the package with ‘ pip install sweetviz ’
Now we will add a dummy dataset for the demonstration.
import pandas as pd
penguins = pd.read_csv('penguins.csv')
#define X and y
X = penguins.drop('species', axis=1)
y = penguins['species']
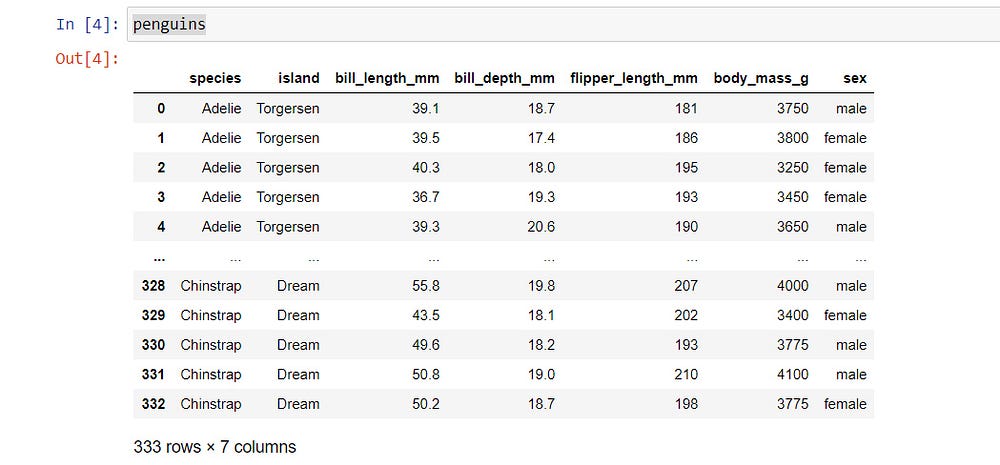
Offcourse don’t try out with any dataset of your choice. Haiyaaaaa need to learn how to joke in between! kidding…..
Copy — Paste
import sweetviz as sv
analyze_report = sv.analyze(penguins)
analyze_report.show_html('analyze.html', open_browser=False)
Done!….
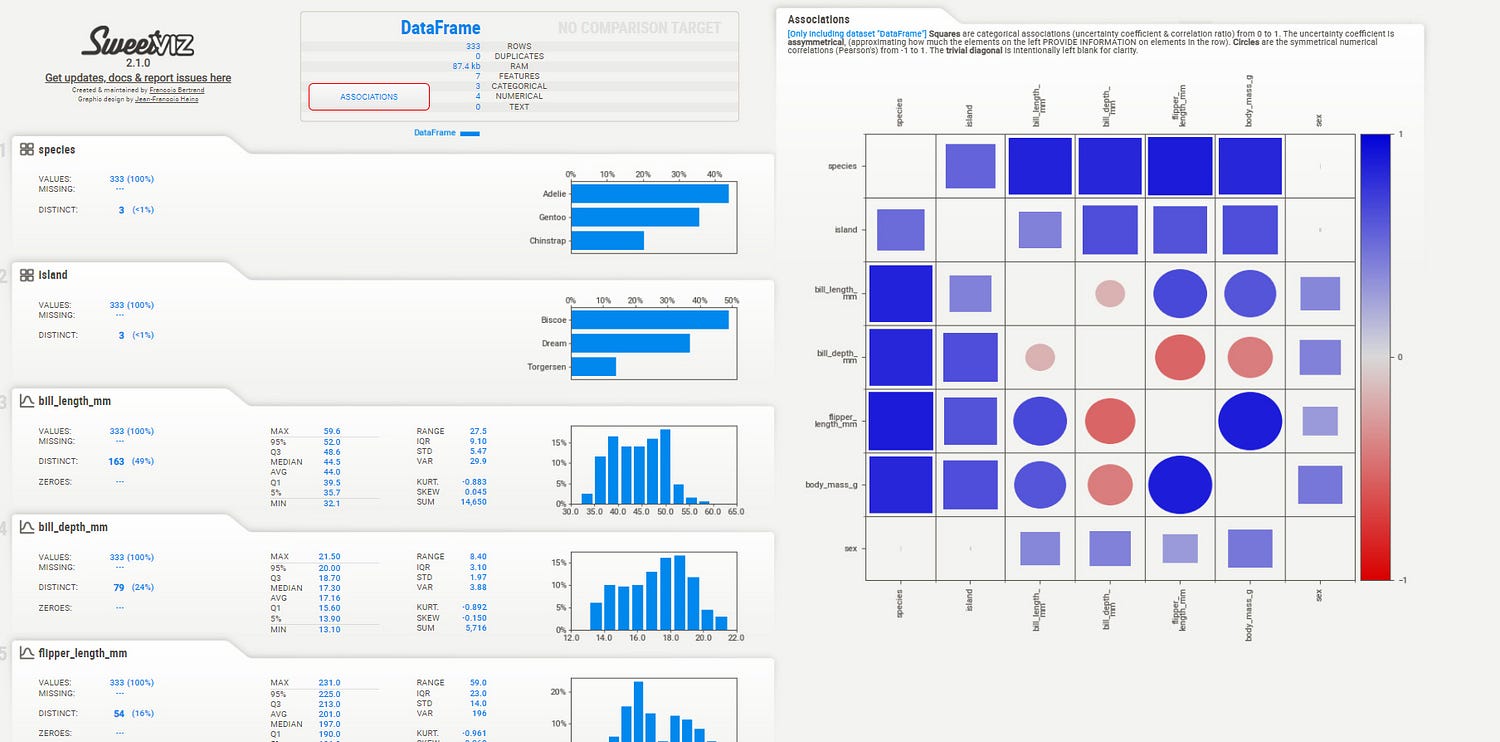
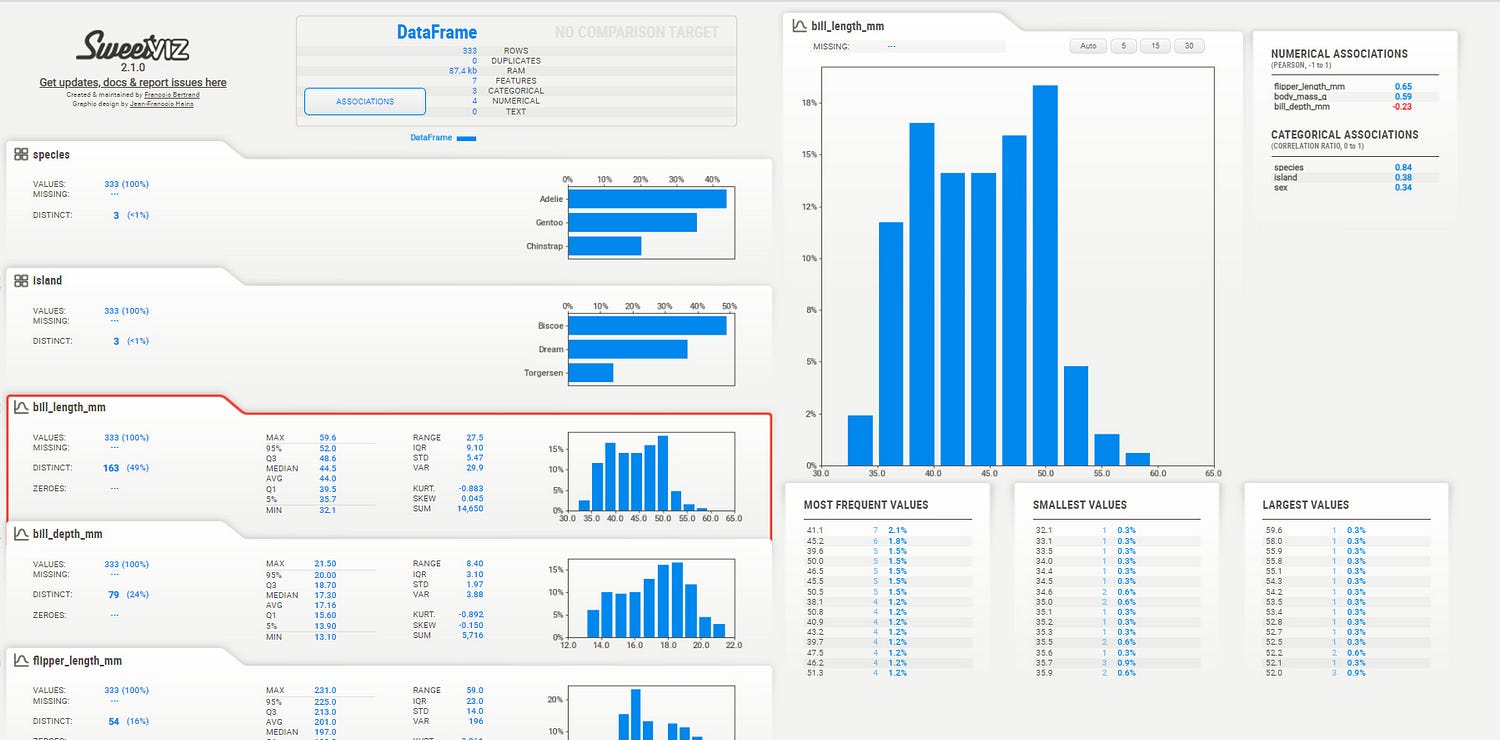
analyze_report.show_html will save it as a report in your default working directory as ‘analyze.html’
Now let’s perform the comparison.
#as usual split the dataset
from sklearn.model_selection import train_test_split
X_train, X_test, y_train, y_test = train_test_split(X, y, test_size=0.2)
#Comparison Report
import sweetviz as sv
comparison_report = sv.compare([X_train, 'Train'], [X_test, 'Test'])
comparison_report.show_html('comparison.html', open_browser=False)
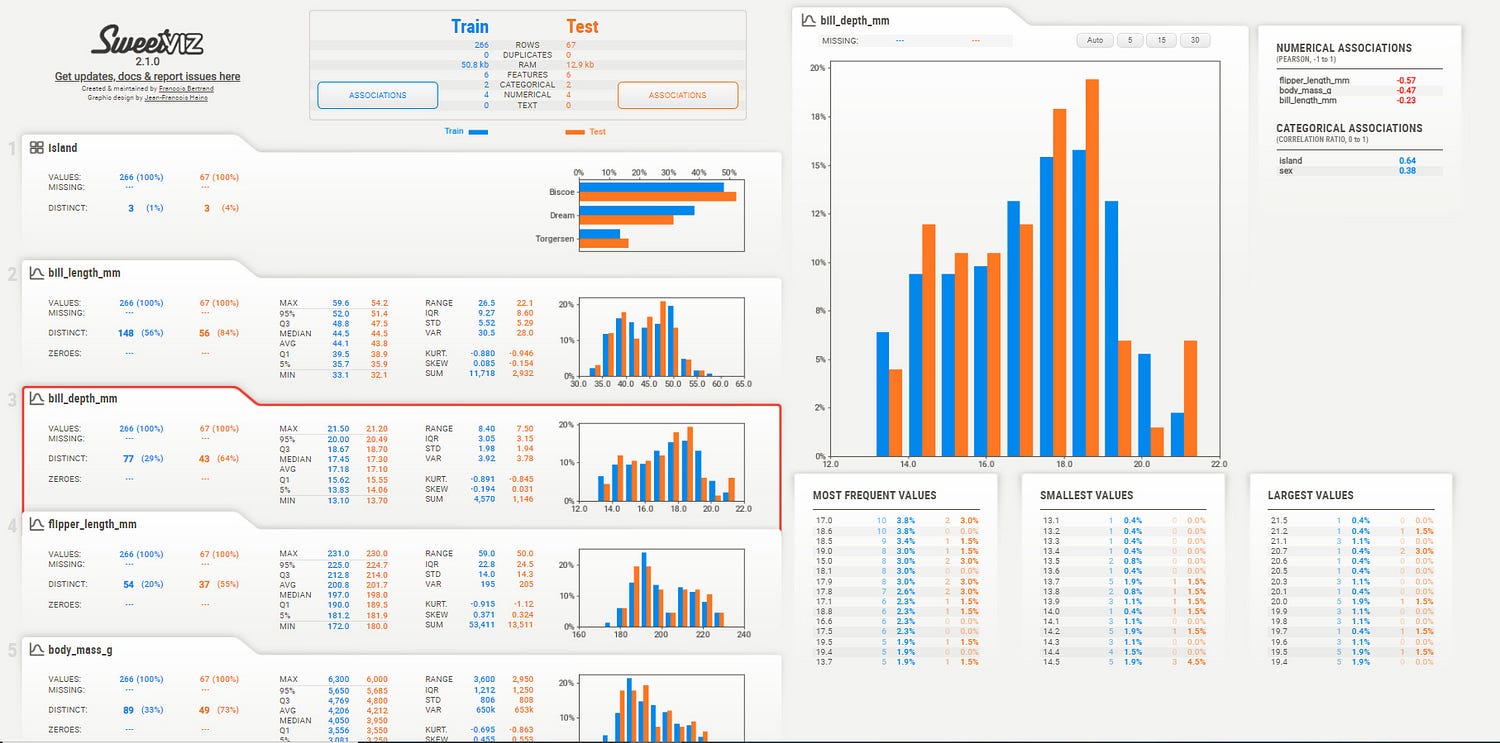
Now one more, if we need to perform intra comparison
intra_comparison = sv.compare_intra(X_train, X_train["sex"] == "male", ["male", "female"])
intra_comparison.show_html('intra_compare.html', open_browser=False)
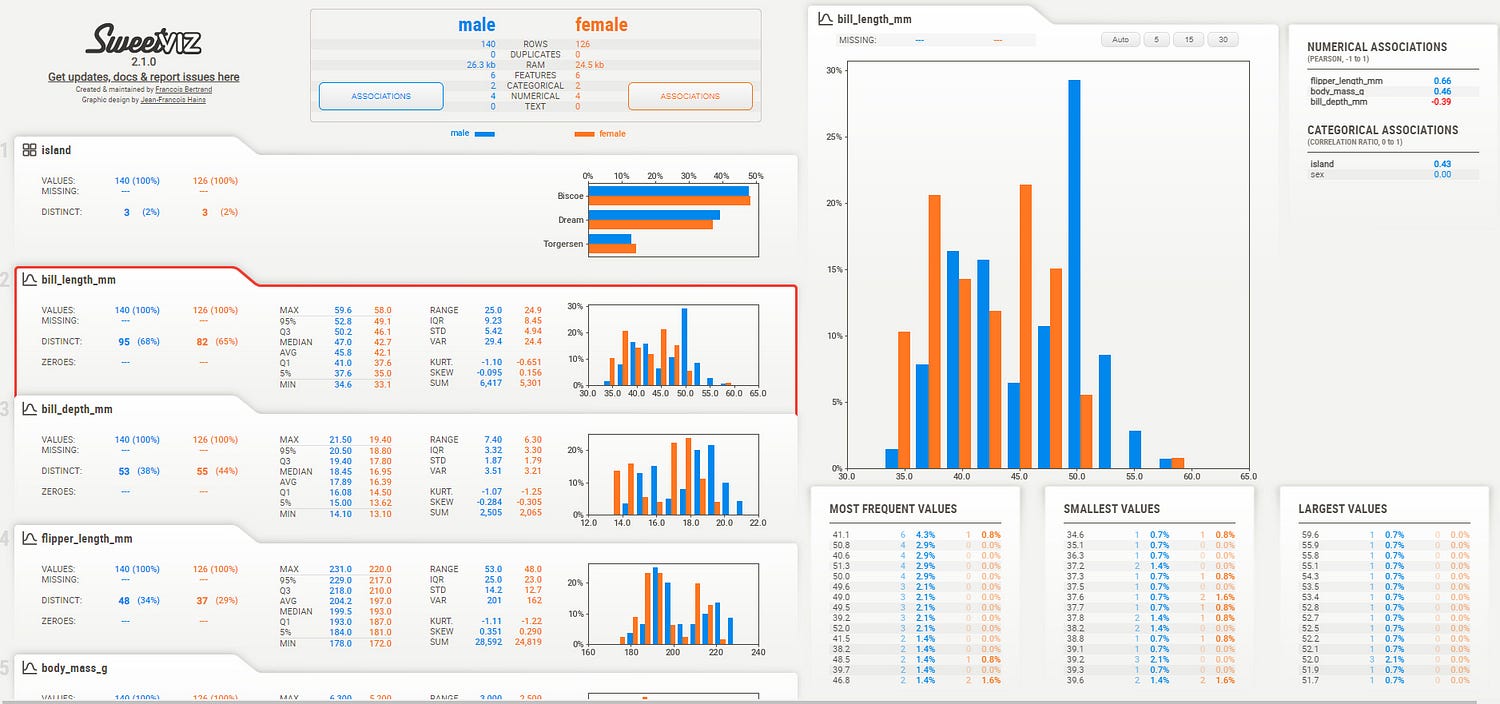
Congratulations! go go go start sharing the HTML reports and impress others!
Did you enjoy it? if so let me know…….do browse my other articles I guarantee you will like them too. See you soon with another interesting topic.
Some of my alternative internet presences are Facebook, Instagram, Udemy, Blogger, Issuu, and more.
Also available on Quora @ https://www.quora.com/profile/Rupak-Bob-Roy
Have a good day.

Comments
Post a Comment