Facebook Prophet For Uni-variate Time Series

So what is Prophet?
Prophet is an open-source library published by Facebook designed to forecast Uni-variate time series data based on decomposition (trend+Seasonality+holidays) components. With prophet is easier to use and find a good set of hyperparameters automatically in an effort to make skillful forecasts for data with trends without needing the requirement of special domain knowledge.
The prophet also provides a custom easy ways to tune the hyperparameters even for someone who lacks expertise in forecasting models to make skillful forecasts for a variety of problems in a business scenario.
The working of Prophet model:
Prophet uses time as regressor to fit several linear and non linear functions of time as components.
In prophet, we use 3 components: trend, seasonality, and holidays.
Trend:
The trend is modeled by fitting a linear curve over the data/trend or non-periodic part of the time series. The linear approach ensures that it is least affected by missing values, extreme values, or any other anomalies.
Seasonality:
To fit and forecast the seasonality, the prophet relies on fourier series to provide a flexible model.
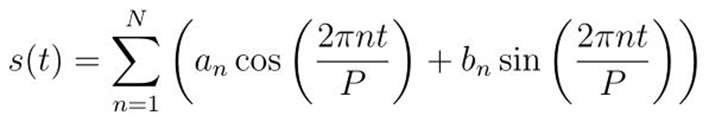
P is the period eg. 365.25 /year
Parameters [a1, b1, ….., aN, bN] need to be estimated for a given N to model seasonality.
The fourier order N defines whether high-frequency changes are allowed to be modeled or not.
If a user feels the high frequency/extreme values components are just noise or an anomaly and should be considered for modeling. The user can lower the values of N
Holidays:
Holidays and random events also play a crucial role in the spikes of time series analysis and we tend to forget to mark such events with the continuous tsunami of data. So to overcome such challenges prophet provides additional parameters that can be fitted to the model to reflect the effect of holidays and events.
Changepoints: an another important terminology in Prophet model to answer whether the time series encounters any underlying changes in the on-going predefined strategy like launching of a new product or a brand etc. At such points, the growth rate/ time series trend tends to change and this is what we call it as changepoints.
In Prophet these changepoints are automatically selected. However, a user can manually change the changepoints if required depending on the business requirements.
There are 2 problems when the changepoints have extremely high or low values.
a.) Overfitting and b.) Underfitting
However, a parameter ‘changepoint_prior_scale’ is provided to adjust and overcome the overfitting and underfitting challenges.
List of Prophet Parameters:
Trend Parameters:
Parameter Description
growth                     linear’   or ‘logistic’ to specify a
                           linear or logistic trend
changepoints               List   of dates at which to include
                           potential changepoints (automatic
                           if not specified)
n_changepoints             If   changepoints in not supplied, you
                           may provide the number of changepoints
                           to be automatically included
changepoint_prior_scale    Parameter for changing flexibility of
                           automatic changepoint selection
Seasonality & Holiday Parameters:
Parameter Description
yearly_seasonality Fit yearly seasonality
weekly_seasonality Fit weekly seasonality
daily_seasonality Fit daily seasonality
holidays Feed dataframe containing holiday name and date
seasonality_prior_scale       Parameter   for changing strength of
                              seasonality model
holiday_prior_scale           Parameter   for changing strength of
                              holiday model
yearly_seasonality, weekly_seasonality & daily_seasonality are of boolean type: ‘True/False’
Now let’s see how quickly we can implement this.
#check prophet version
Import fbprohet
#print version number
Print(‘Prophet %s % fbprophet.___version__)
However, I have noticed there are some compatibility issues with python versions but works well with python 3.9. You may also try these few lines of tweaks if you are facing problems like failed importing fbprophet inside spyder console but working fine in the cmd.
Troubleshooting:
On Prompt install Ephem:
 conda install -c anaconda ephem
Install Pystan:
 conda install -c conda-forge pystan
Finally install Fbprophet
 conda install -c conda-forge fbprophet
For this example, we will use our famous car dataset.
#load the data set (car sales)
from pandas import read_csv
from matplotlib import pyplot
from pandas import to_datetime
from fbprophet import Prophet
#load data
path = ‘car_dataset.csv’
df = read_csv(path, header=0)
#summarize shape
print(df.shape)
#show first few rows
print(df.head())
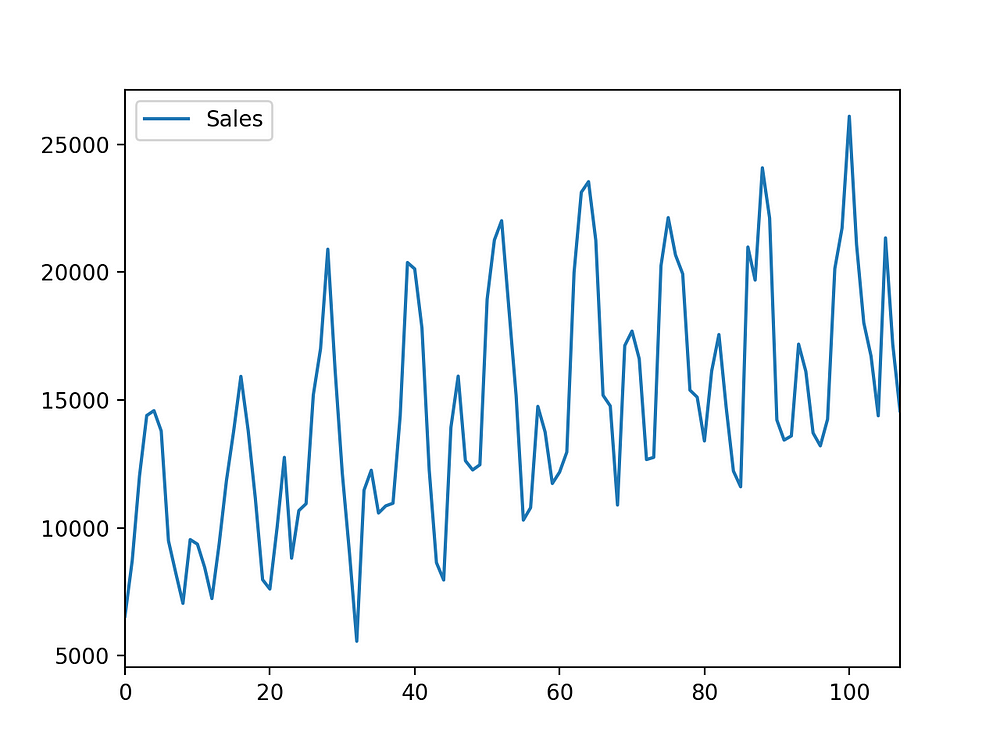
#plot the time series
df.plot()
pyplot.show()
“The Prophet() object takes arguments to configure the type of model you want, such as the type of growth, the type of seasonality, and more. By default, the model will work hard to figure out almost everything automatically.”
Prophet expects the data to be in a specific format that is in ‘ds’ = date format column & ‘y’ = dependent variable
#Create the expected columns
#rename the columns
df.columns = ['ds','y']
#change the date column in date format
df['ds']=to_datetime(df['ds'])
#define the model
model = Prophet()
#m = Prophet(yearly_seasonality = True, seasonality_prior_scale=0.1)
#fit the model
model.fit(df)
“Predictions are then made on a data frame with a column ds containing the dates for which a prediction is to be made. You can get a suitable data frame that extends into the future a specified number of days using the helper method Prophet.make_future_dataframe.’’
#creating date(ds) column of same length
future = model.make_future_dataframe(periods=213)
future.tail()
#the predicted value will be labeled as yhat
forecast = model.predict(future)
forecast[['ds', 'yhat', 'yhat_lower', 'yhat_upper']].tail()
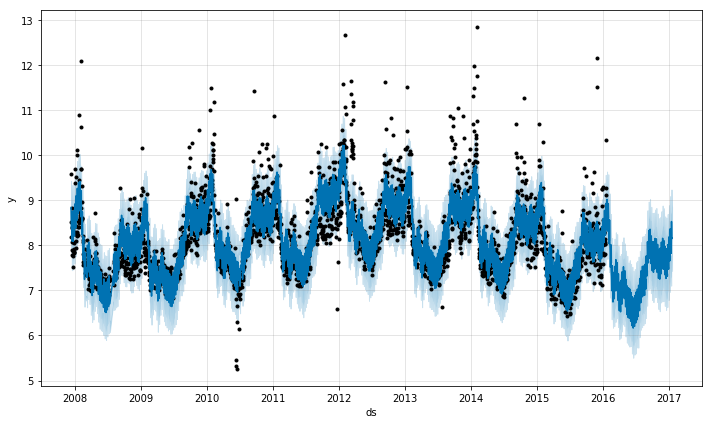
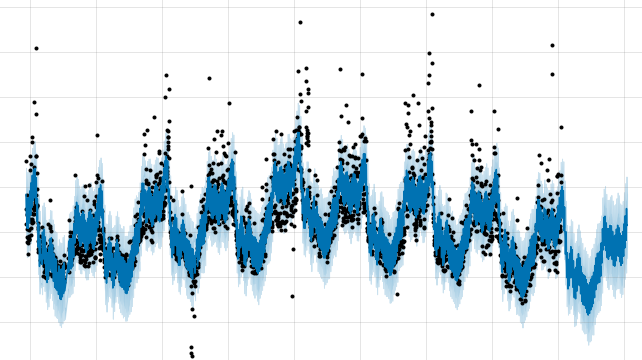
#we can simple take a look bytearray
model.plot(forecast)
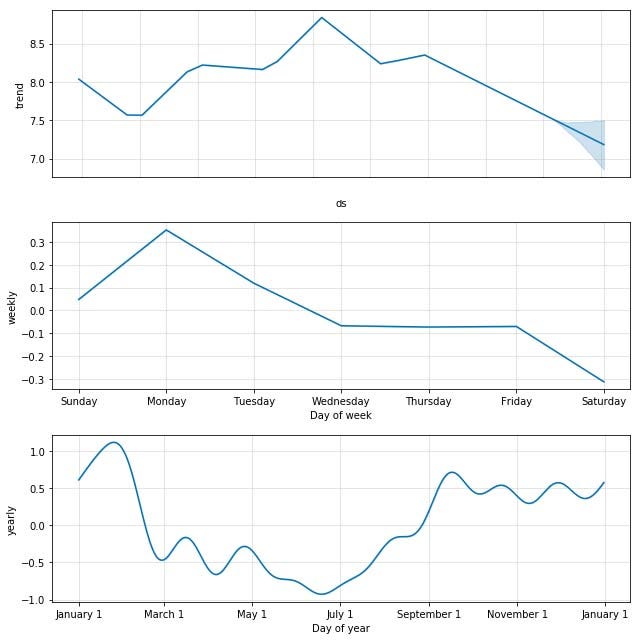
#we can look at its varies components
model.plot_components(forecast)
![forecast[[‘ds’, ‘yhat’, ‘yhat_lower’, ‘yhat_upper’]].tail()](https://cdn-images-1.medium.com/max/1000/1*iq8dx_STUmMSoX5-ERHeAg.jpeg)
#An interactive forecast and components can be created by using plotly. But you will need to install plotly 4.0 or above separately, as it will not by default be installed with fbprophet.
from fbprophet.plot import plot_plotly, plot_components_plotly
plot_plotly(model, forecast)
plot_components_plotly(m, forecast)
Evaluate Model Performance technique
by machinelearning mastery.com
Well, we need some type of evaluation to access the performance of our model and for this model we can achieve this by holding some data back from the model like the last 12 months data, then fitting the model on the first portion of the data, using it to make a prediction on the data that we will hold back and then calculate the error measure like mean absolute error across the forecasts.
The score gives an estimate of how well we might expect the model to perform on average when making an out-of-sample forecast.
To do this we will have to create a new data frame for training the last 12months removed.
#create test dataset, remove last 12 months
train = df.drop(df.index[-12:])
print(train.tail())
A forecast can then be made on the last 12 months of date-times.
We can then retrieve the forecast values and the expected values from the original dataset and calculate a mean absolute error metric using the scikit-learn library.
from sklearn.metrics import mean_absolute_error
#calculate MAE between expected and predicted values for December
y_true = df['y'][-12:].values
y_pred = forecast['yhat'].values
mae = mean_absolute_error(y_true, y_pred)
print('MAE: %.3f' % mae)
#output
MAE: 1336.814
So we have an error if approximately 1336 sales which seems to be much lower/better than our traditional persistence model
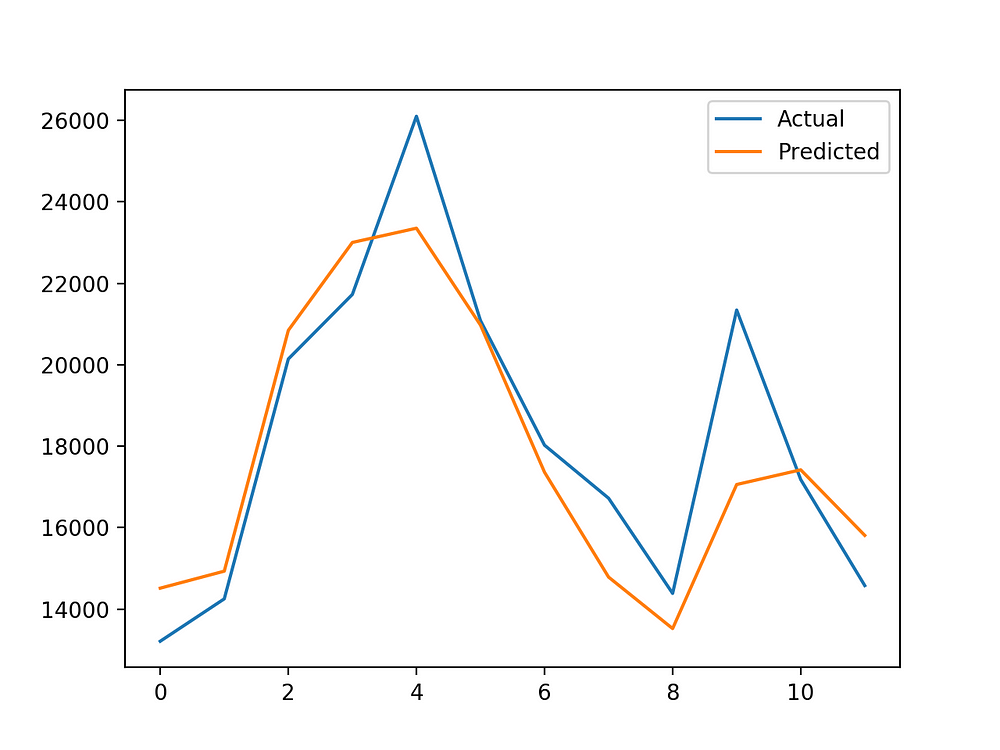
With the value, we can also plot the expected vs predicted values to observe how well our model performed.
#plot expected vs actual
pyplot.plot(y_true, label='Actual')
pyplot.plot(y_pred, label='Predicted')
pyplot.legend()
pyplot.show()
So this is it….. end of the chapter of our new Time Series model: fbprophet
Thanks for your time I tried my best to keep it short and simple keeping in mind to leverage this method for daily time series quick skillful analysis.
I hope you enjoyed it.
Feel Free to ask because “Curiosity Leads To Perfection”
Some of my alternative internet presences are Facebook, Instagram, Udemy, Blogger, Issuu, and more.
Also available on Quora @ https://www.quora.com/profile/Rupak-Bob-Roy
Stay tuned for more updates.! have a good day….
~ Be Happy and Enjoy!


Comments
Post a Comment